> ## Documentation Index
> Fetch the complete documentation index at: https://docs.repacket.com/llms.txt
> Use this file to discover all available pages before exploring further.
# Dashboard
> Monitor security activity and threats across your organization with real-time insights
The Dashboard provides a comprehensive overview of security activity across your organization, helping you quickly identify threats, monitor trends, and respond to security events in real-time.
## Overview
The Dashboard is your central command center for monitoring and managing security across your organization. It provides real-time visibility into threats, policy violations, and security events, enabling you to quickly identify and respond to potential security issues.
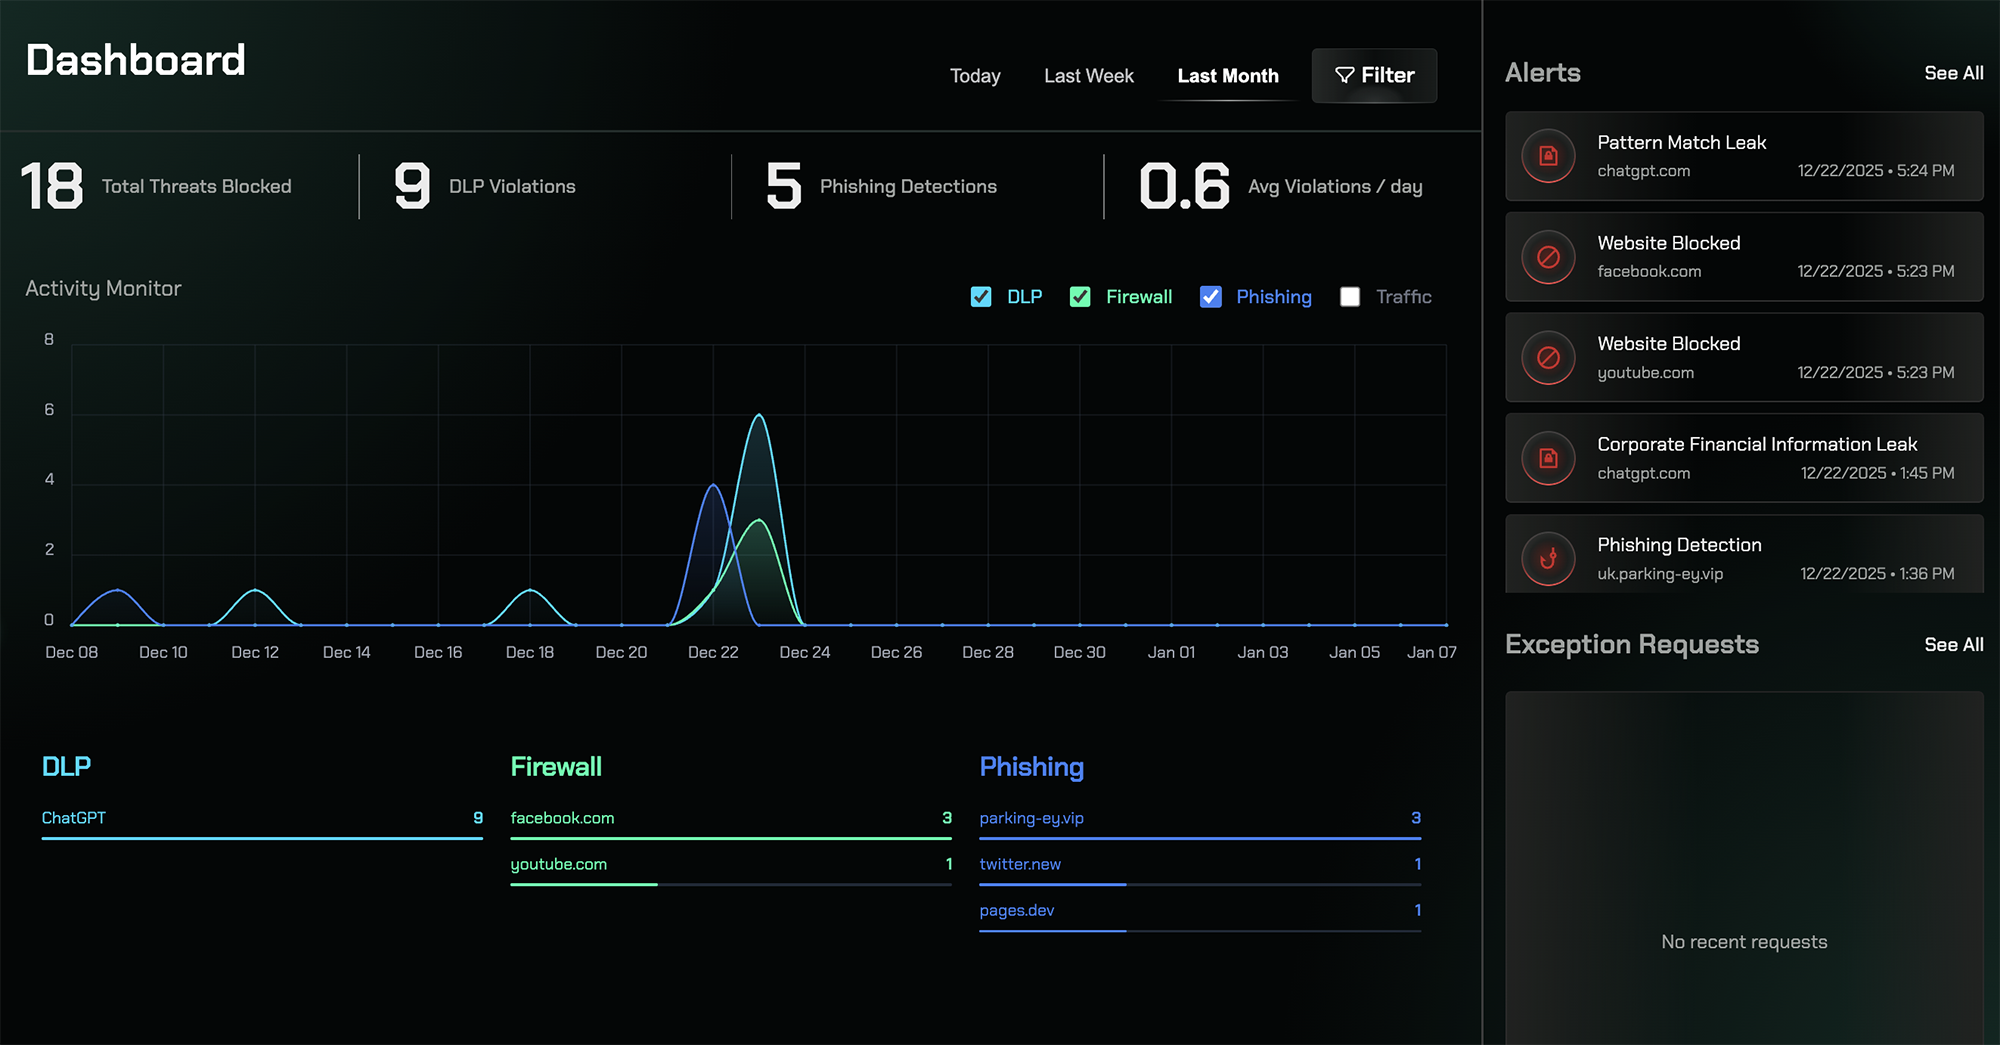 Monitor security events and threats as they occur across your organization
View high-level statistics including blocked threats, DLP violations, and phishing detections
Track security events over time to identify patterns and unusual behavior
Review alerts organized by security category for quick analysis
## Dashboard Components
### Summary Metrics
At the top of the dashboard, summary metrics provide an at-a-glance view of your organization's security posture. These key performance indicators show:
* **Threats Blocked**: Total number of security threats that have been prevented
* **DLP Violations**: Count of Data Loss Prevention policy violations detected
* **Phishing Detections**: Number of phishing attempts identified and blocked
These metrics help you quickly assess the overall security status and identify areas that may need attention.
### Activity Chart
The activity chart visualizes security events over your selected time range, displaying when events occurred throughout the day, week, or month. This timeline view helps you:
* Identify spikes in security activity
* Detect unusual patterns or anomalies
* Correlate events with specific time periods
* Track trends over time
By visualizing event frequency, you can quickly spot potential security incidents that require investigation.
### Detection Categories
Below the activity chart, security detections are organized by category to help you understand which types of threats are most prevalent:
* **Data Loss Prevention (DLP)**: Shows destinations where sensitive data uploads were detected or blocked
* **Firewall**: Displays blocked or warned access attempts to restricted categories or domains
* **Phishing**: Highlights phishing attempts that were identified and prevented
This categorization enables you to focus your investigation efforts on the most critical threat types affecting your organization.
### Alerts Panel
The Alerts panel provides a chronological list of individual security events, allowing you to:
* Review events in the order they occurred
* Investigate specific incidents quickly
* Access detailed information about each alert
* Take immediate action on security events
Each alert includes relevant context such as the user, destination, time, and threat type, making it easy to determine the appropriate response.
### Exception Requests
The Exception Requests section displays user requests to bypass security rules, giving you visibility into:
* Who requested access to blocked resources
* What resources were requested
* When the requests were made
* The current status of each request (pending, approved, or denied)
This section helps you manage user access requests while maintaining security policies and provides an audit trail of exception approvals.
## Accessing the Dashboard
Visit the [Security Dashboard](https://app.repacket.com/dashboard) in your Repacket dashboard to view real-time security activity and monitor threats across your organization.
## Related Features
View detailed security alerts and notifications
Review comprehensive activity logs for investigation
Configure DLP rules to protect sensitive data
Manage firewall rules that generate dashboard events
Monitor security events and threats as they occur across your organization
View high-level statistics including blocked threats, DLP violations, and phishing detections
Track security events over time to identify patterns and unusual behavior
Review alerts organized by security category for quick analysis
## Dashboard Components
### Summary Metrics
At the top of the dashboard, summary metrics provide an at-a-glance view of your organization's security posture. These key performance indicators show:
* **Threats Blocked**: Total number of security threats that have been prevented
* **DLP Violations**: Count of Data Loss Prevention policy violations detected
* **Phishing Detections**: Number of phishing attempts identified and blocked
These metrics help you quickly assess the overall security status and identify areas that may need attention.
### Activity Chart
The activity chart visualizes security events over your selected time range, displaying when events occurred throughout the day, week, or month. This timeline view helps you:
* Identify spikes in security activity
* Detect unusual patterns or anomalies
* Correlate events with specific time periods
* Track trends over time
By visualizing event frequency, you can quickly spot potential security incidents that require investigation.
### Detection Categories
Below the activity chart, security detections are organized by category to help you understand which types of threats are most prevalent:
* **Data Loss Prevention (DLP)**: Shows destinations where sensitive data uploads were detected or blocked
* **Firewall**: Displays blocked or warned access attempts to restricted categories or domains
* **Phishing**: Highlights phishing attempts that were identified and prevented
This categorization enables you to focus your investigation efforts on the most critical threat types affecting your organization.
### Alerts Panel
The Alerts panel provides a chronological list of individual security events, allowing you to:
* Review events in the order they occurred
* Investigate specific incidents quickly
* Access detailed information about each alert
* Take immediate action on security events
Each alert includes relevant context such as the user, destination, time, and threat type, making it easy to determine the appropriate response.
### Exception Requests
The Exception Requests section displays user requests to bypass security rules, giving you visibility into:
* Who requested access to blocked resources
* What resources were requested
* When the requests were made
* The current status of each request (pending, approved, or denied)
This section helps you manage user access requests while maintaining security policies and provides an audit trail of exception approvals.
## Accessing the Dashboard
Visit the [Security Dashboard](https://app.repacket.com/dashboard) in your Repacket dashboard to view real-time security activity and monitor threats across your organization.
## Related Features
View detailed security alerts and notifications
Review comprehensive activity logs for investigation
Configure DLP rules to protect sensitive data
Manage firewall rules that generate dashboard events